Unreached People Groups
of North America

VIEW THEM ALL

Unreached People Groups of North America

UPGNorthAmerica.com seeks to mobilize prayer warriors and laborers among the most significant unreached people group communities in North America. God has provided a unique opportunity in this age of mass migration and technological connection. UPGNorthAmerica.com helps the unreached people groups in North America become visible. Once Christians know more about them and have seen them (even if virtually), barriers are broken, bridges are created, and a sense of responsibility is gained as we become aware of the open doors for the gospel before us. 
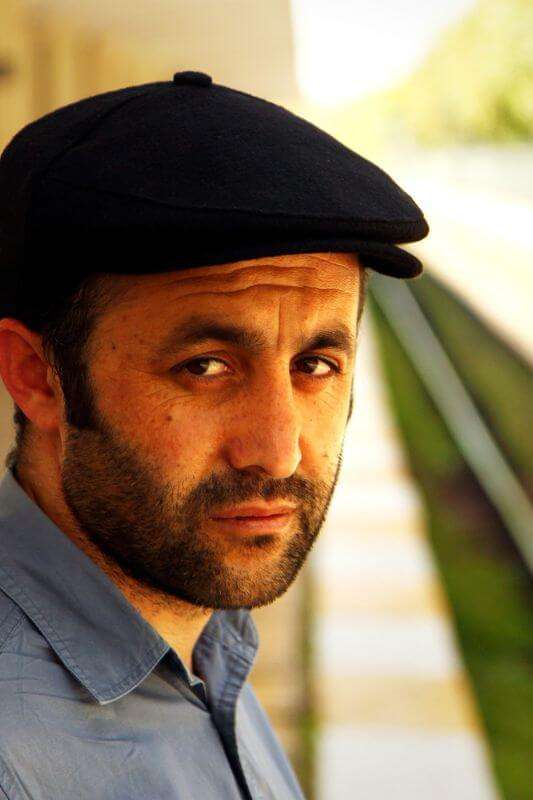
Turkish man in Chicago

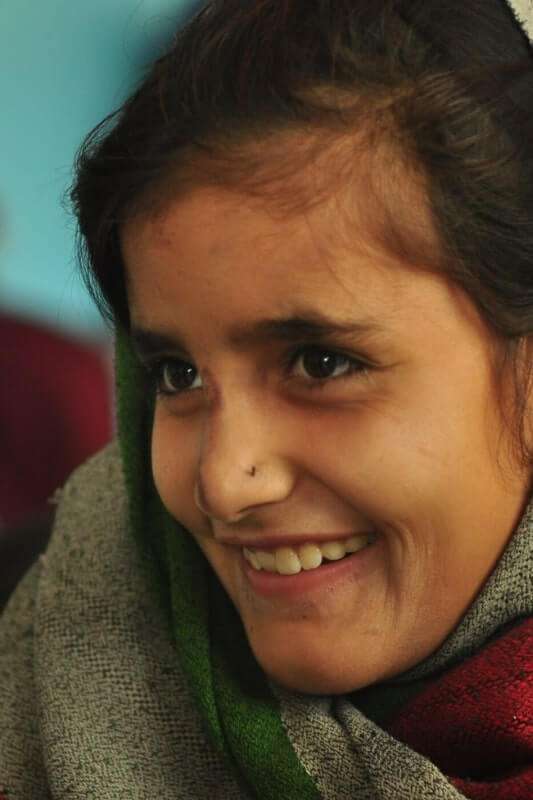
Afghans

Indian Hindi

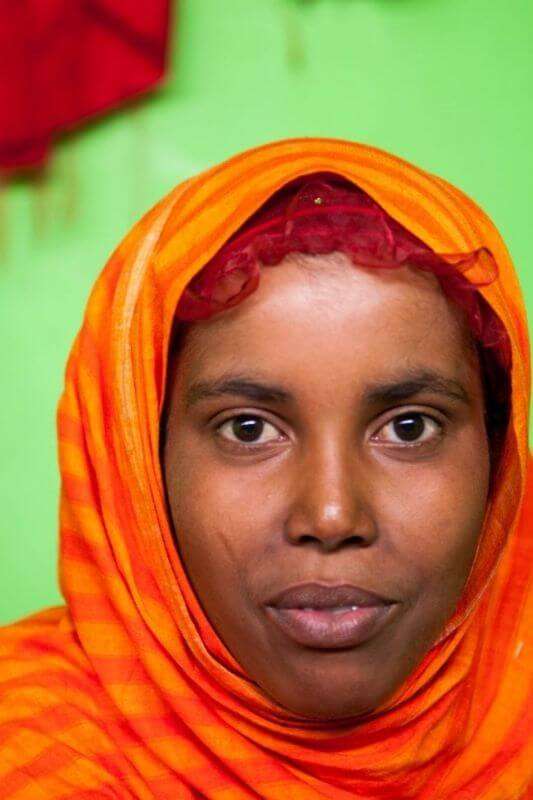
Somalis

Turkish man in Chicago

Turks

Virtual Prayer Walks

Take A Virtual Prayer Walk

Map of the Most Significant Unreached
People Group Communities in North America

This dynamic map is automatically updated from the UPG Priority Matrix. The UPG Priority Matrix identifies the most significant unreached people group communities in North America for whom prayer and laborers are needed (Luke 10:2). The icons on the map represent an unreached people group’s primary religious identity: Muslim, Sikh, Jewish, Buddhist, or Hindu. You can select an icon for more details about a particular unreached people group community. You can also filter the map however you would like using the filter tool (use Ctrl/Cmd to select multiple options). For a short explanation of the filter categories, expand the module below. For a longer explanation of the UPG Priority Matrix, visit this FAQ page from Global Gates.

Explanation of Map Filter Categories

People Group

The primary identity of the unreached people group. In North America, sometimes the group more strongly identifies, organizes, and socializes on a nationalistic level (e.g., Pakistani) more than a purely ethno-linguistic level (e.g., Sindhi). Sometimes the people group name is associated more with language than an actual people group identity because of people’s tendency to organize around those who speak the same primary language (e.g., Indian Hindi).

Priority Score

The priority score is factored using the following weighted categories: the people group’s population size in a city, amount of Christians among that people group in the city, amount of ministry being done among that people group in the city, amount of churches started for that people group in the city, the global significance of a people group’s presence in a city, and the people group’s global status of evangelical Christianity. The higher the score, the more that people group is in need of prayer and gospel laborers.

Primary Religion

This category simply identifies the primary religious identity of a people group (e.g., even though a significant minority of Bangledeshis are Hindu, the majority of Bangladeshis identify as Muslim and thus appear under Muslim).

Primary Country of Origin

This category indicates the primary country from which a people group originates. In our modern world, people are sometimes migrating multiple times before arriving in North America. We are identifying not necessarily from where a people group is migrating from but where they originate. For example, many Tibetans migrate from India and Nepal to North America, but their primary country of origin, at least on a globally recognized geo-political level, is China.

Region of Origin

The region of origin is the general region of the world from which a people group originates in recent history. For example, many of the Jewish groups on the list are under Europe.

GSEC Score

The Global Status of Evangelical Christianity index number is listed under the people group’s profile on peoplegroups.org (and sometimes joshuaproject.net). On these sites, we look at the GSEC score for the country where the people group’s population is largest for the best representation of a global number. We then enter a score on our Matrix from 0-100 based on the GSEC score (GSEC 0=100, GSEC 1=65-95, GSEC 2=35-60, GSEC 3=5-30).

The Global Status of Evangelical Christianity scores are as follows:

0 = No evangelical Christians or churches. No access to evangelical print, audio, visual or human resources.

1 = Less than 2 percent evangelical. Some evangelical resources available. No active church planting within the past two years.

2 = Less than 2 percent evangelical. Initial or localized church planting within the past two years.

3 = Less than 2 percent evangelical. Dispersed or widespread church planting within the past two years.

Population Size in City

This category identifies the estimated population size of the people group in a particular metropolitan area. A people group has to number at least 5,000 in a metropolitan area to make this list and map (i.e., we are not identifying all unreached people group communities in North America, only those that are most in need of prayer and laborers). For information on people groups smaller in size, try searching on peoplegroups.info.

Churches Started in City

One of the ways to identify unreached people groups is there are no, or too few, local churches in which a people group can be easily incorporated. Therefore, this category measures church planting efforts in a metropolitan area to see if there are:

  • No churches remotely similar in culture to an unreached people group. Matrix score = 100.
  • Non-evangelistic or near-culture churches to an unreached people group (e.g., a Syrian Arab Christian-background church might speak the same, or similar language, as Egyptian Arab Muslims but would not easily incorporate an Egyptian Muslim-background family, or even a Syrian Arab Muslim-background family, because of cultural difference and/or animosity toward Muslim-background people). Matrix score = 60-95.
  • At least one evangelistic church that could easily incorporate the focused people group (e.g., a Bangla-speaking church w/ over one-half of their members being recent Muslim-background converts would likely be active evangelists among Bangladeshi Muslims and able to incorporate new believers into their fellowship or start new churches among them). Matrix score = 40-55.
  • Several evangelistic churches among the people group who are actively evangelizing their people and could easily incorporate new believers into their churches or start new churches among them. If several evangelical churches exist among a people group in a specific metropolitan area, the need for cross-cultural workers is greatly diminished. Matrix score = 15-35.
  • A church planting movement is taking place among an unreached people group in a metropolitan area. That is, disciples and churches are multiplying rapidly with indigenous leadership. If such a movement is taking place, cross-cultural evangelists are not needed. In fact, they could actually hinder the movement. Matrix score = 5-10.
Map Legend

= Muslim

= Hindu

= Sikh

= Buddhist

= Jewish

People Group
Priority Score
Primary Religion
Primary Country of Origin
Region of Origin
GSEC Score
Population Size in City
Churches Started in City
  

100,000 Yemenis

Statistics Canada 2016 counted 6,645 people whose ethnic origin was Yemeni. The 2019 American Community Survey counted 58,627 people born in Yemen now living in the United States. Counting U.S.-born children and typical undercounts of Arabs in the census, it is safe to assume there are at least 100,000 Yemenis in North America. The Wikipedia article on Yemeni Americans claims "there are an estimated 100,000-200,000 Yemenis living in the United States as of 2018,” but no source is given for that statistic.

You have Successfully Subscribed!

350,000 Bosniaks

The Congress of Bosniaks of North America estimate 300,000 Bosniaks live in the United States and 50,000 in Canada.

You have Successfully Subscribed!

300,000 Somalis

The America Community Survey 2019 estimated 182,951 people reporting Somali ancestry in the United States. Statistics Canada 2016 estimated 62,500 people with Somali ethnic origin in Canada. Census figures tend to undercount groups like Somalis who are suspicious of government authorities and census takers. Community estimates of Somalis in the Greater Toronto and Edmonton areas alone number 100,000. An estimated 300,000 Somalis in North America is a conservative estimate, and their population number could be much higher.

You have Successfully Subscribed!

670,000 to 1,000,000 Sikhs

In the 2011 Statstics Canada census, 454,965 Sikhs were estimated to live in Canada. The United States does not count religious affiliation in its census, and the language of Punjabi is also spoken by Hindus and Muslims which makes "language spoken at home" a difficult category for measuring Sikhs. However, the 2012 Pew Religious Survey indicates 5% of Indian Americans are Sikh. The 2019 American Community Survey estimated 4,240,466 Asian Indians living in the United States, and 5% of that population equals 212,023. The Sikh America Coalition, however, estimates 500,000 Sikhs living in the United States. Therefore, low estimates of Sikhs in North America are around 670,000 people and high estimates are around one million.

You have Successfully Subscribed!

400,000 Afghans

The diversity of the people groups who identify as Afghans contributes to the difficulty of using census information to estimate the number of Afghans in North America. The American Community Survey 2019 counted 156,434 people in the United States with "Afghan" ancestry. However, some Afghans would identify their ancestry as Tajik, Pashtun, and so forth. Statistics Canada 2016 counted 83,995 people with Ethnic Origin as Afghan, 4,810 as Pashtun, 2,905 as Tajik, and 1,515 as Hazara. So, adding those number together gives a good idea of a low estimate of the number of Afghans in Canada. Allied Media Corporation, who has worked extensively with the Afghan American Community, estimates 300,000 Afghans live in the United States. With adding Canada's number, a reasonable estimate of Afghans in North America is 400,000 people.

You have Successfully Subscribed!

Estimated 40,000 Kurds in the United States and 16,315 Kurds in Canada

A 2019 BBC article estimated 40,000 Kurds in the United States, as did a much earlier NBC News Report. A 2009 Kurdish Herald aricle estimated 50,000 Iraqi Kurds were living in the United States. The estimates of Kurds we have found in various cities seem to coincide with the more conservative 40,000 number. However, many Kurds from Turkey mix into the Turkish population and are harder to identify. Statistics Canada 2016 estimated 16,315 people in Canada had a Kurdish Ethnic Origin.

You have Successfully Subscribed!

Between 275,000 and 350,000 Turks living in North America

The Turkish Coalition of America gives a conservative community estimate of 350,000 Turks in the United States. According to American Community Survey 2019, 212,489 Turkish people were estimated to live in the United States. Statistics Canada 2016 reported 63,966 with a Turkish ethnic origin.


You have Successfully Subscribed!

1,100,000


Pakistan makes up the largest single country of origin of Muslims in North America, with 769,000. 554,000 (2019 ACS) reside in the United States and 215,000 (2016 Census) in Canada.

Statistically, it is estimated that 370,000 Indo-Pak Muslims in North America originated of Indian descent. 270,000 reside in the United States and 100,000 reside in Canada. A Pew Research study found that 10% of Indian descent in North America identify as Muslim. It is by using this 10% and total Indian population numbers that the Indo-Pak Muslims from India are calculated.

You have Successfully Subscribed!

Estimated 66,000 Wolof in the United States

According to ACS and the Senegalese-American Association estimates listed in articles in previous years, it is safe to assume there are at least 60,000 Wolof in North America. The previous population and community estimates within NYC have listed the Wolof population around 20,000 not including the Wolof that live in Chicago, Seattle, Raleigh, Montreal, etc. Information from Peoplegroups.org lists the population around 66,000. 

You have Successfully Subscribed!

Approximately 972,000 Gujaratis call North America home

20% of all Indians in the United States are from Gujarat state. According to the 2019 5-yr table ACS Census Data, there are 4,240,466 Indians in the United States. Statistically, there are approximately 848,093 Gujaratis in the United States. The 2016 Candian Census indicates that 124,030 speak Gujarati in the home. 

You have Successfully Subscribed!

1,871,837

The U.S. Census American Community Survey 2019 estimated 3,995,755 people with Asian Indian ancestry in the U.S. Pew Research indicates that 36% of all Indian descent population in the U.S. identify as Hindi. Therefore the estimate of Asian Indians who identify as Hindi is 1,438,472. Statistics Canada 2016 counted 433,365 Hindi Knowledge of Language in Canada. Using census information instead of community estimates helps compare populations of people groups in various cities. However, the population is likely more extensive than this number.

You have Successfully Subscribed!

approximately 67,000

According to the American Community Survey 2019, 65,126 Uzbek people are estimated to live in the United States. Statistics Canada 2016 reported 1715 with an Uzbek ethnic origin.

You have Successfully Subscribed!

150,000

There are 132,477 people estimated to be born in Israel living in the United States (ACS 2019) and 21,155 in Canada (Stats Canada 2011; the 2016 count seriously undercounted Jewish populations). Community estimates are often much higher than these official census counts.

You have Successfully Subscribed!

255,000

Statistics Canada 2016 counted 103,940 people whose ethnic origin was Morocco. The 2019 American Community Survey counted 83,842 people born in Morocco and now living in the United States. Counting U.S.-born children and typical undercounts of Arabs in the census, it is safe to assume there are at least 150,000 Moroccan Arabs in North America. 

You have Successfully Subscribed!

320,000

The 2019 ACS 1-year estimates report over 249,000 individuals of Iraqi descent in the United States, and over 70,000 people reported Iraqi origin according to the 2016 Statistics Canada. Unfortunately, it is difficult to determine the exact number of Iraqi-Americans. Actual numbers are likely much higher. 

You have Successfully Subscribed!

50,000 Tunisian Arabs

Statistics Canada 2016 counted 25,645 people whose ethnic origin was Tunisian. The 2019 American Community Survey does not count Tunisians.  Based on this article published in a Tunisian magazine, the number of Tunisians living in North America in 2016 was 44,195. We assume that the number has increased since then and approximate the number of Tunisian Arabs living in North America to be around 50,000.

You have Successfully Subscribed!

The United States has a population of 168,000 Palestinian Arabs while Canada has a 44,800 strong Palestinian Arab population.

The 2019 American Community Survey counted 139,398 people of Palestinian ancestry. A report by the Arab American Institute showed that the Arab populations in the US are undercounted by 179.56% and approximately 67% are Muslim resulting in approximately 168,000 living in the US. Statistics Canada 2016 counted 44,820 people whose ethnic origin was Palestinian. 

You have Successfully Subscribed!

280,000 Thai in North America

Statistics Canada 2016 counted 19,010 people whose ethnic origin was Thai. The 2019 American Community Survey counted 260,820 people born in Thailand and now living in the United States. Counting U.S.-born children and typical undercounts of Thai in the census, it is possible that there are over 400,000 Thai in North America. This Pew Research article estimates 343,000 Thai in the US as of 2019. 

You have Successfully Subscribed!

245,00Arabs of Egyptian origin in North America

According to the Arab American Institute Foundation, Arab populations are undercounted by 79 percent in the United States. According to Pew Research approximately 40% of Epyptians in the US are Muslim. Approximately 44% of Canadian Egyptians are Muslims. These percentages and the total Arab population from the American Community Survey 2019 1-year estimates and 2016 Statistics Canada provide the most accurate estimate while excluding Egyptian Coptics. There are approximately 201,000 Egyptian Arabs in the US and 44,000 in Canada.

You have Successfully Subscribed!

nearly 600,000

Statistics Canada 2016 counted 210,405 people whose ethnic origin was Iranian. The 2019 American Community Survey counted 385,473 people of ethnic Persians living in the United States. Using census information instead of community estimates helps compare populations of people groups in various cities. However, the p is likely larger than the number given.

You have Successfully Subscribed!

12,000 Somali Bantus

In the late 1990s and 2000s, the US resettled around 12,000 Somali Bantu from refugee camps through the UNCHR program. The population is likely much higher than 12,000 since many of the refugees were young and have since started families of their own.

You have Successfully Subscribed!

193,000 Albanian Muslims

The 2019 1-Year United States American Community Estimate Census data reported 199,908 people reporting Albanian ancestry. Statistics Canada 2021 Census data reported 41,625 people indicating Albanian ethnic origin. These numbers were multiplied by 0.80 to get a more accurate number of those identifying as Muslim. Census data provides a baseline population estimate, but numbers are likely much higher. 

You have Successfully Subscribed!